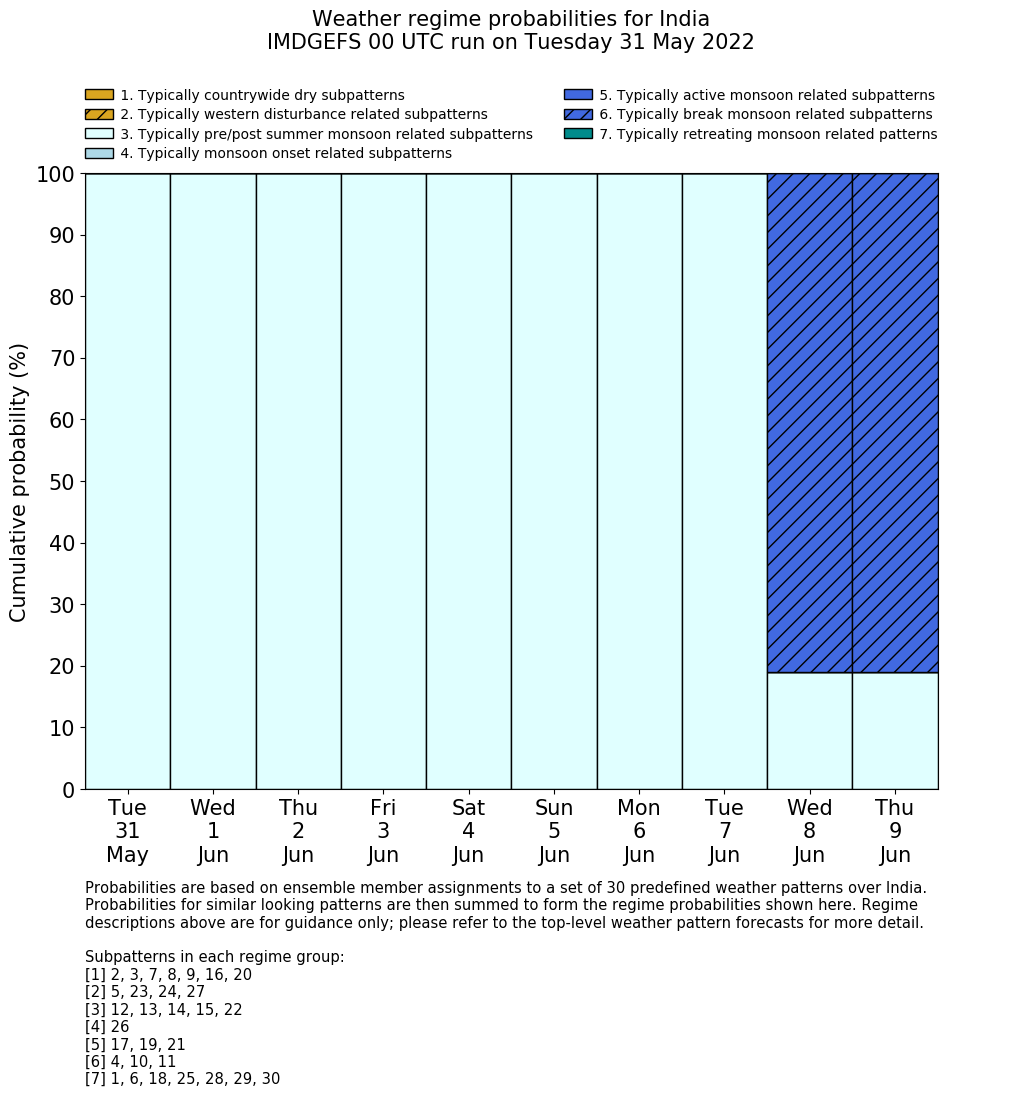
31 May |
1 Jun |
2 Jun |
3 Jun |
4 Jun |
5 Jun |
6 Jun |
7 Jun |
8 Jun |
9 Jun |
Pattern Category | Historical frequency occurrences (April) |
Historical frequency occurrences (May) |
Historical frequency occurrences (June) |
|
|---|---|---|---|---|---|---|---|---|---|---|---|---|---|---|
| Pattern 1 | Retreating Monsoon | 0.2% | 0.1% | 0.0% | ||||||||||
| Pattern 2 | Spring Dry Period | 0.5% | 0.0% | 0.0% | ||||||||||
| Pattern 3 | Spring Dry Period | 0.4% | 0.0% | 0.0% | ||||||||||
| Pattern 4 | 81% | 81% | Break Monsoon | 0.0% | 2.1% | 19.9% | ||||||||
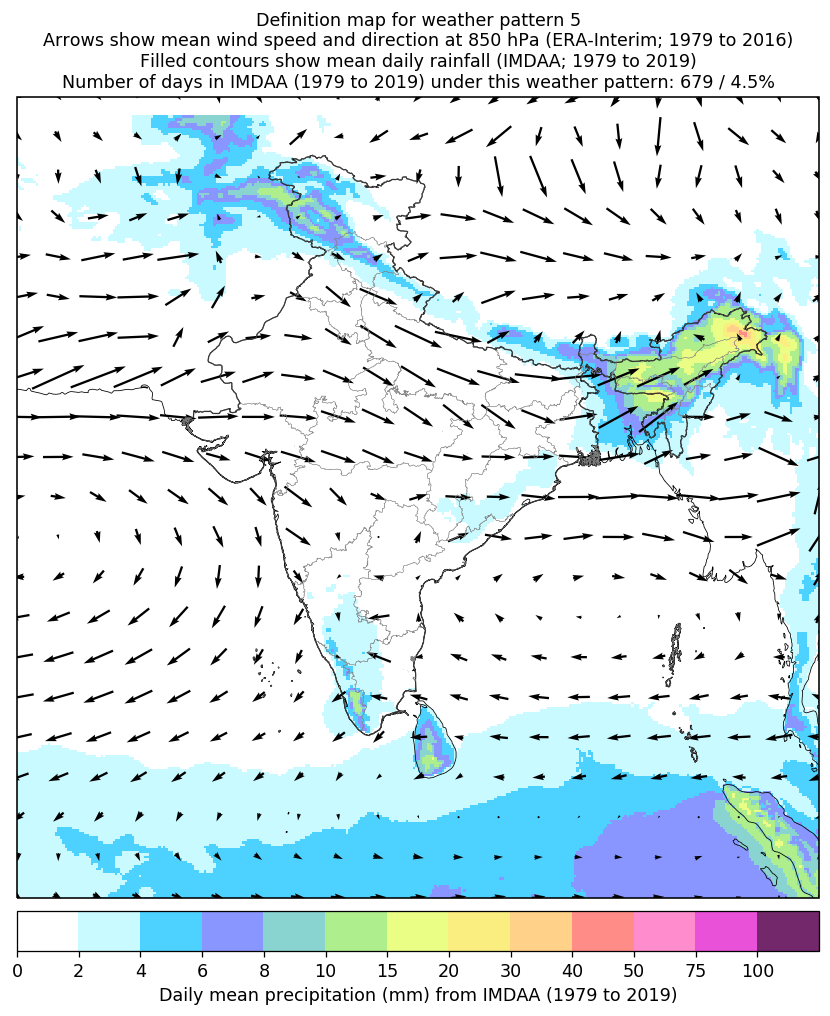
| Pattern 5 | Western Disturbances | 31.5% | 5.8% | 0.0% | ||||||||||
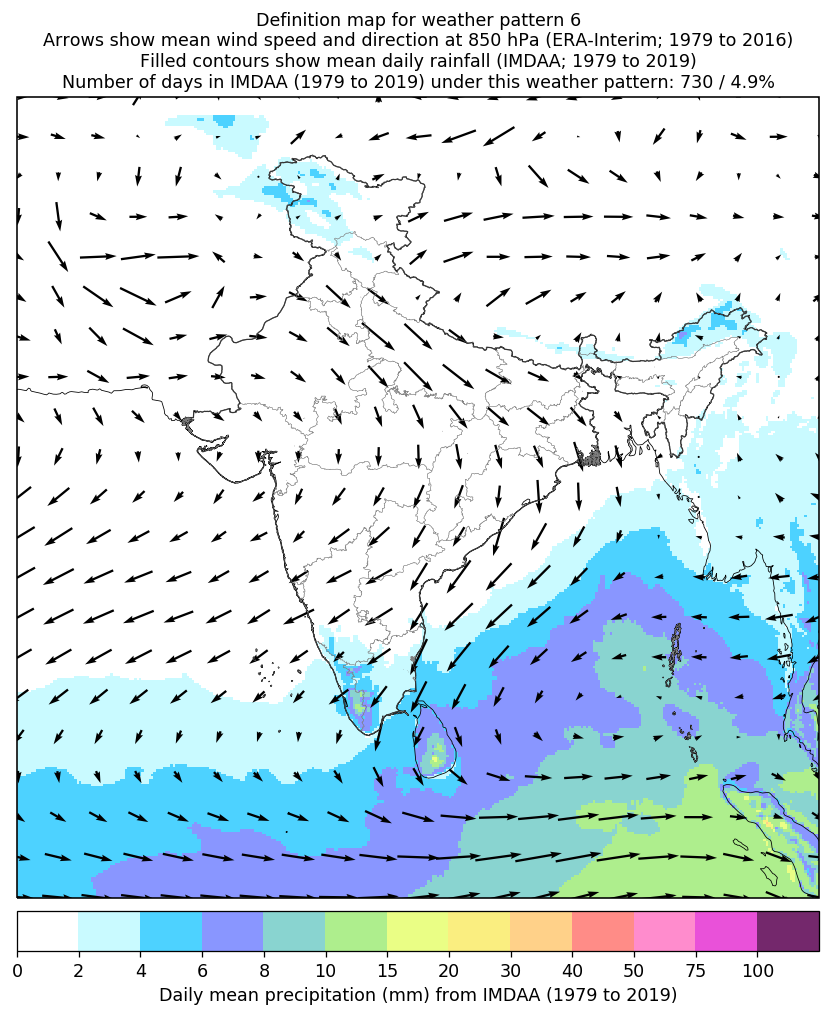
| Pattern 6 | Pre-Monsoon | 1.2% | 0.7% | 0.0% | ||||||||||
| Pattern 7 | Spring Dry Period | 7.5% | 0.5% | 0.0% | ||||||||||
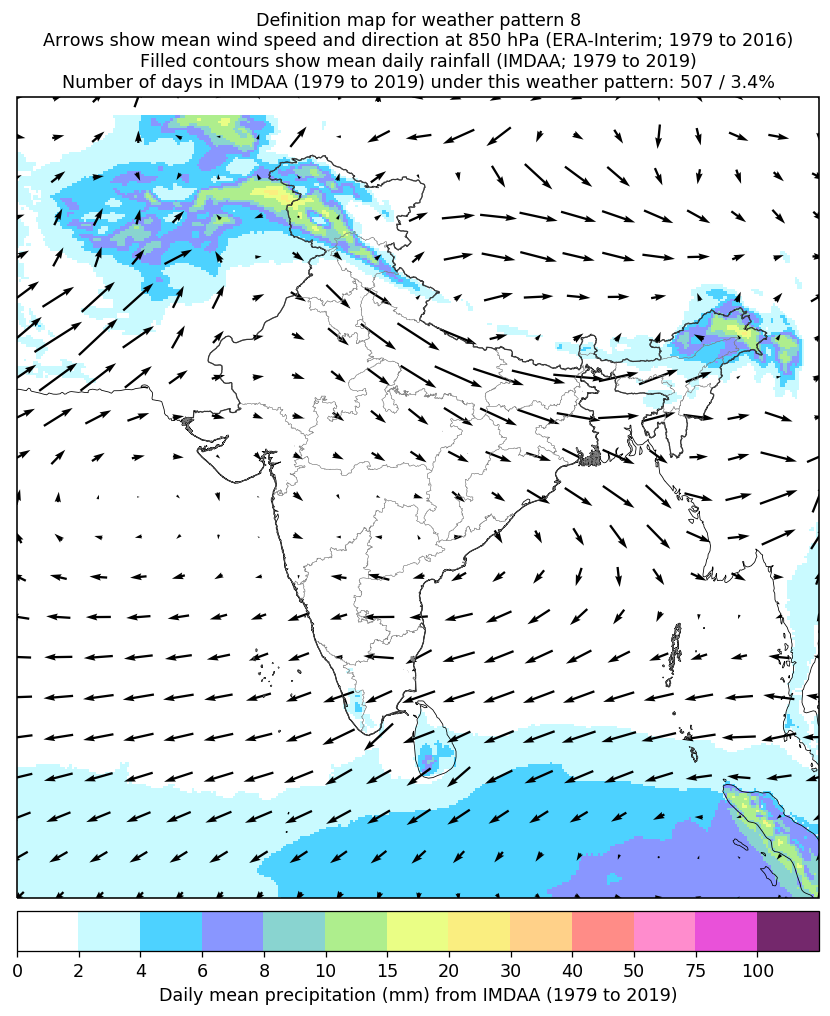
| Pattern 8 | Spring Dry Period | 4.8% | 0.1% | 0.0% | ||||||||||
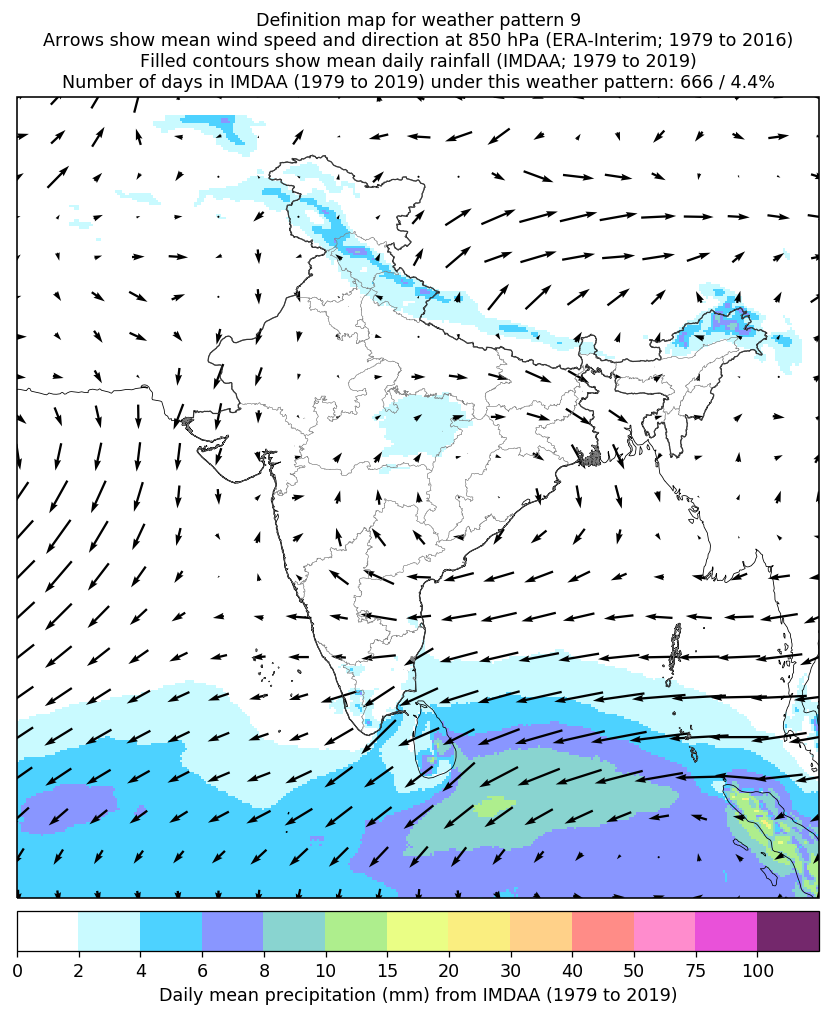
| Pattern 9 | Spring Dry Period | 0.4% | 0.0% | 0.0% | ||||||||||
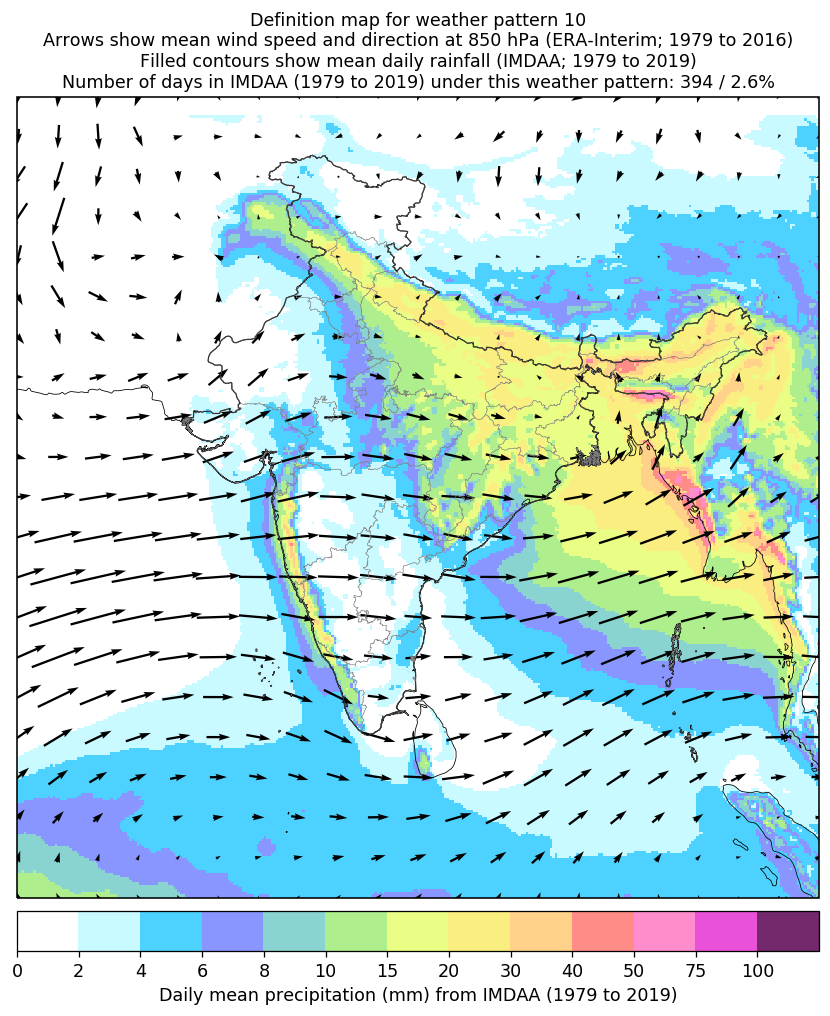
| Pattern 10 | Break Monsoon | 0.0% | 0.1% | 6.5% | ||||||||||
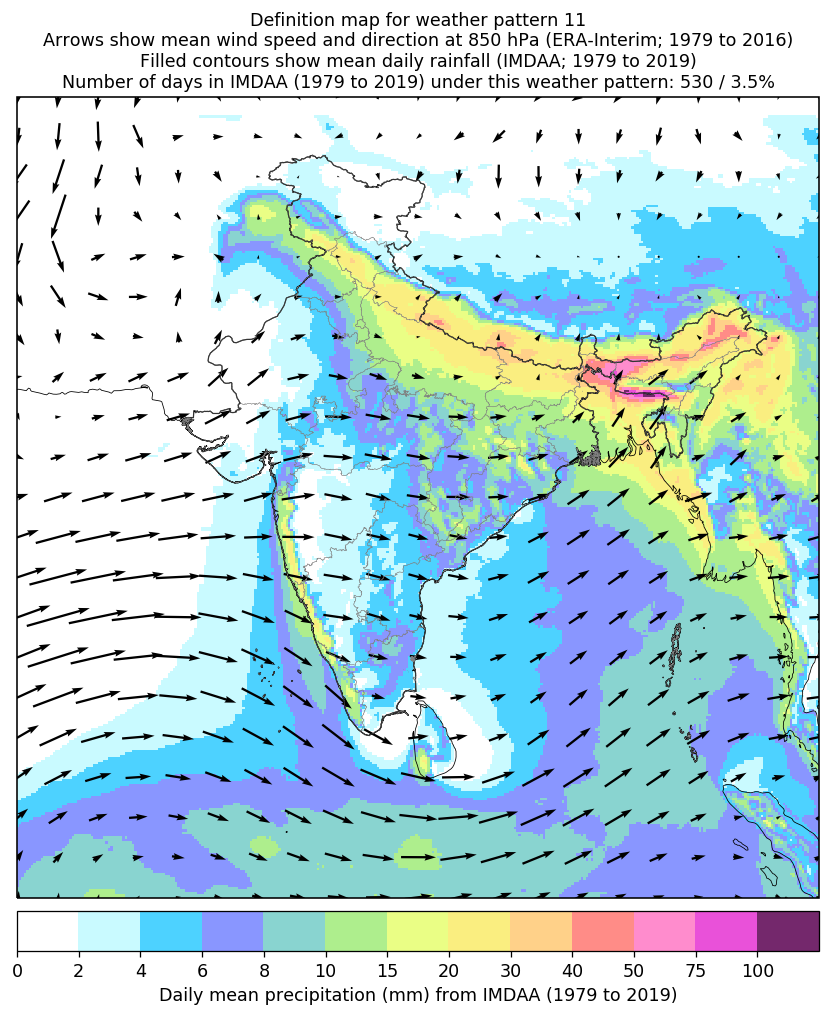
| Pattern 11 | Break Monsoon | 0.0% | 0.7% | 4.4% | ||||||||||
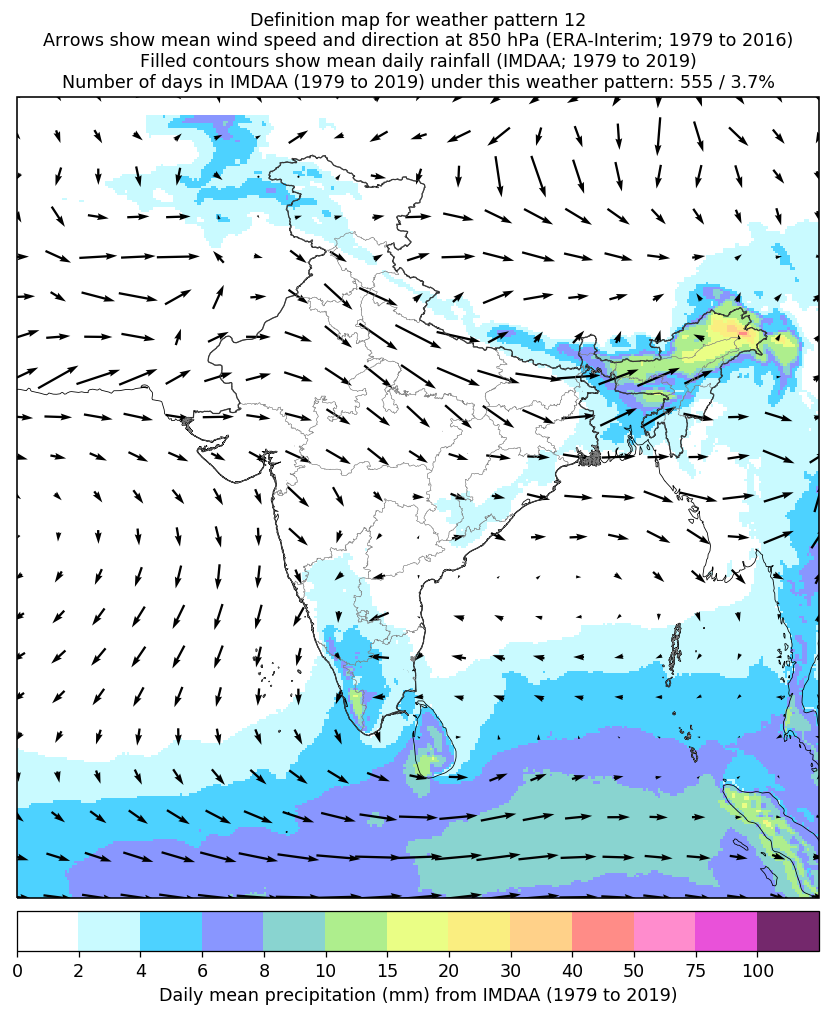
| Pattern 12 | Pre-Monsoon | 21.8% | 12.7% | 0.1% | ||||||||||
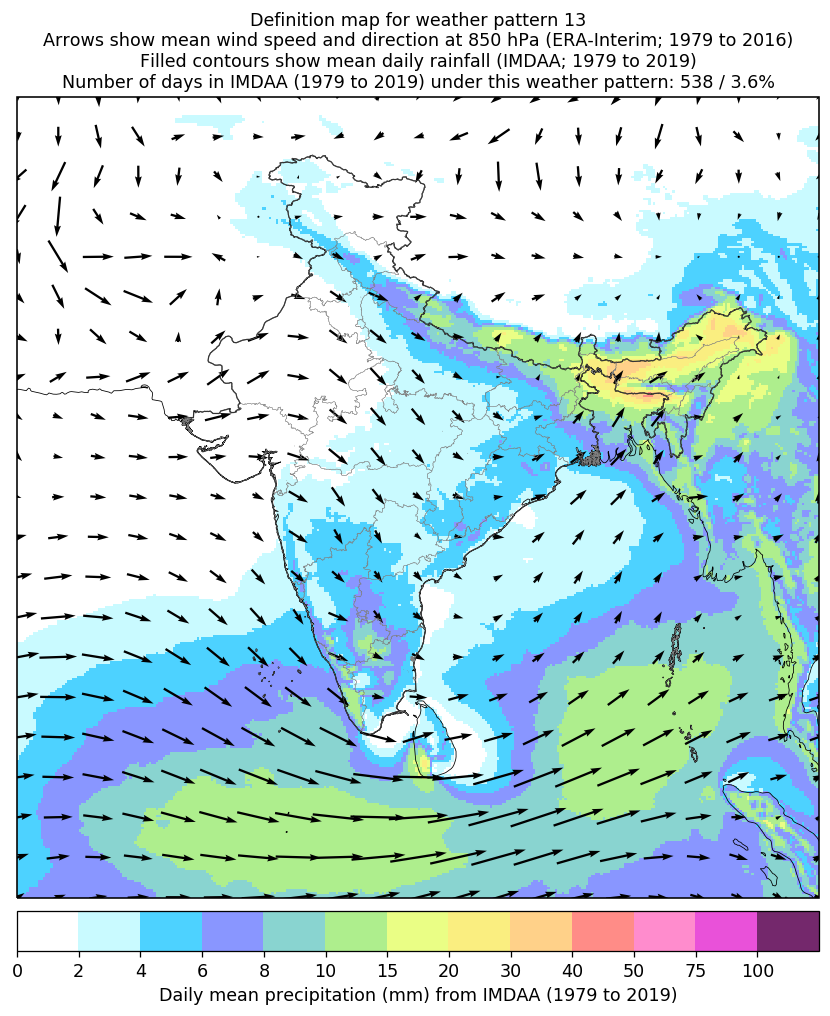
| Pattern 13 | Pre-Monsoon | 1.6% | 12.3% | 4.8% | ||||||||||
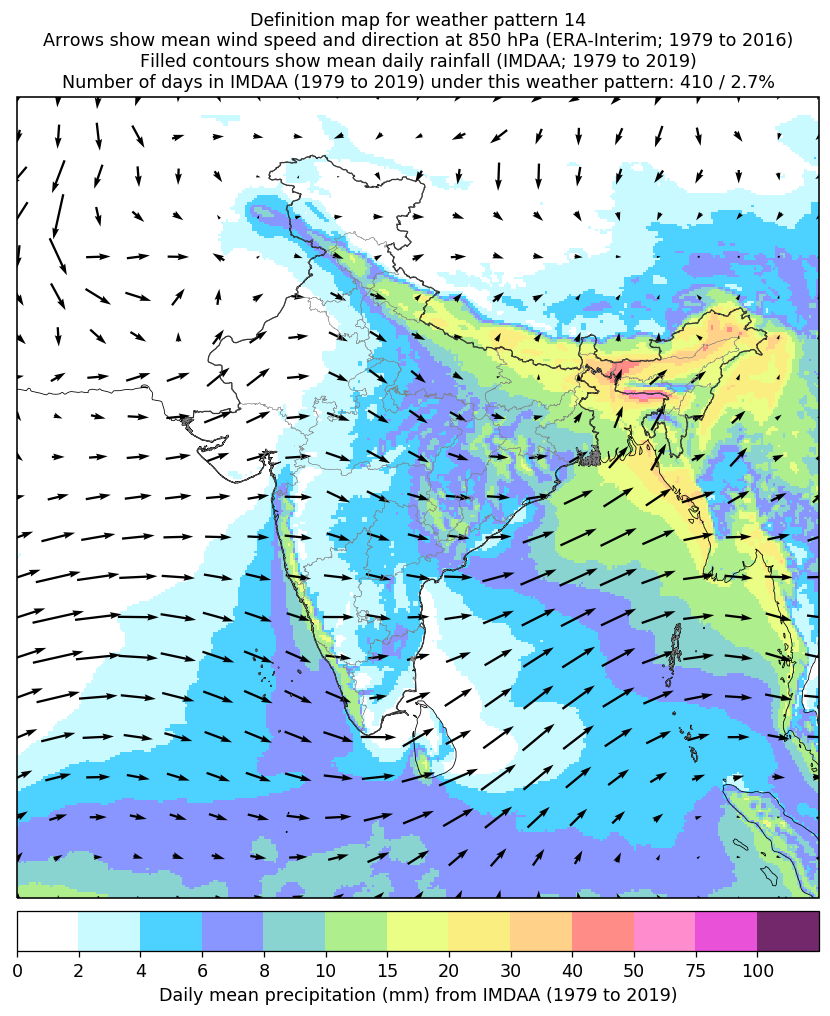
| Pattern 14 | 5% | Pre-Monsoon | 0.0% | 1.7% | 6.3% | |||||||||
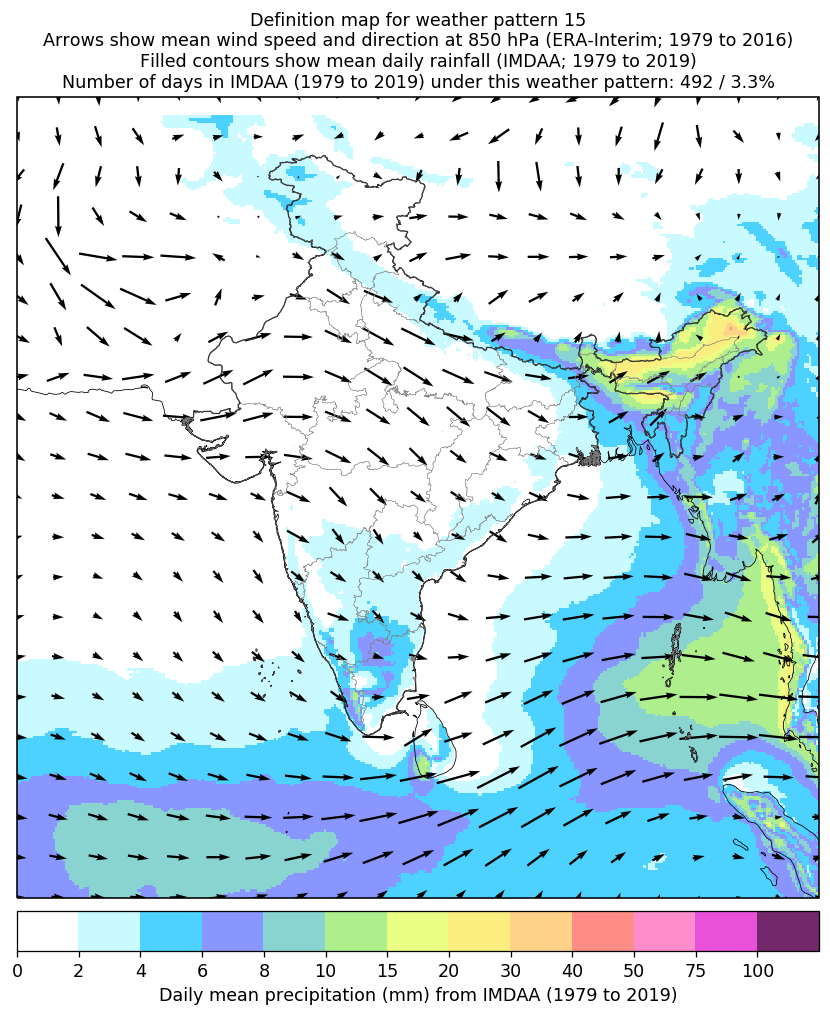
| Pattern 15 | Pre-Monsoon | 1.3% | 19.0% | 3.2% | ||||||||||
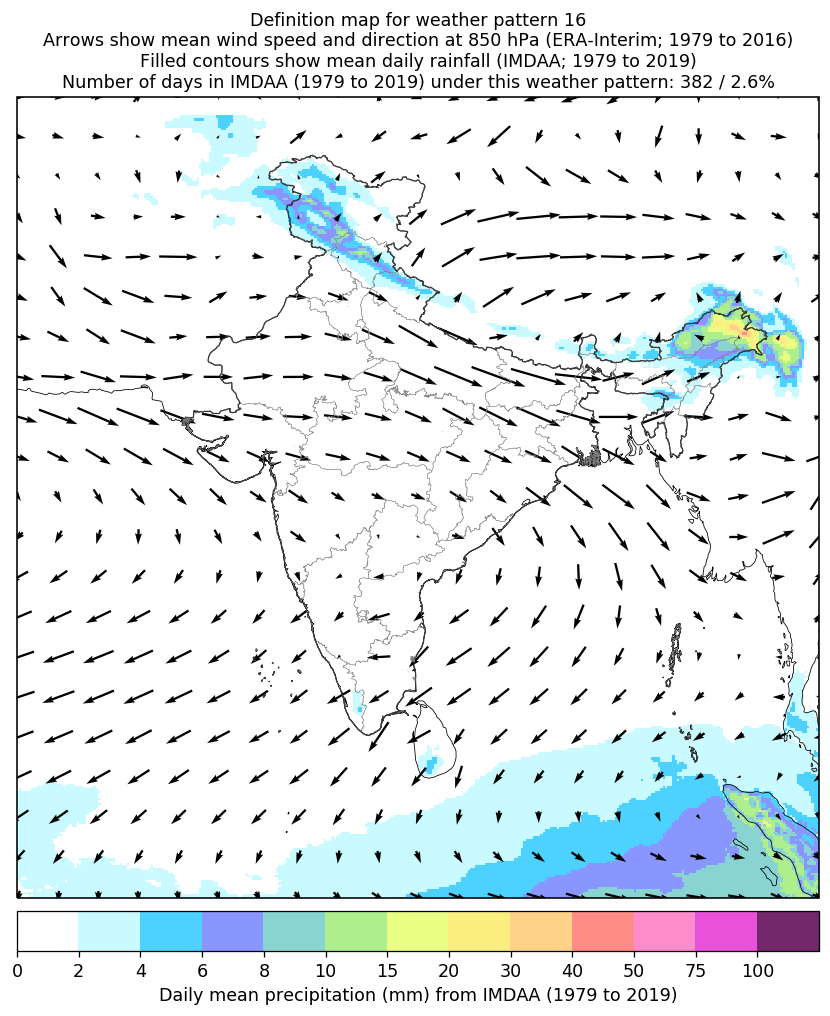
| Pattern 16 | Spring Dry Period | 2.0% | 0.1% | 0.0% | ||||||||||
| Pattern 17 | Active Monsoon | 0.0% | 0.0% | 4.9% | ||||||||||
| Pattern 18 | Active Bay of Bengal | 0.2% | 0.6% | 0.0% | ||||||||||
| Pattern 19 | Active Monsoon | 0.0% | 0.0% | 6.9% | ||||||||||
| Pattern 20 | Spring Dry Period | 1.7% | 0.2% | 0.0% | ||||||||||
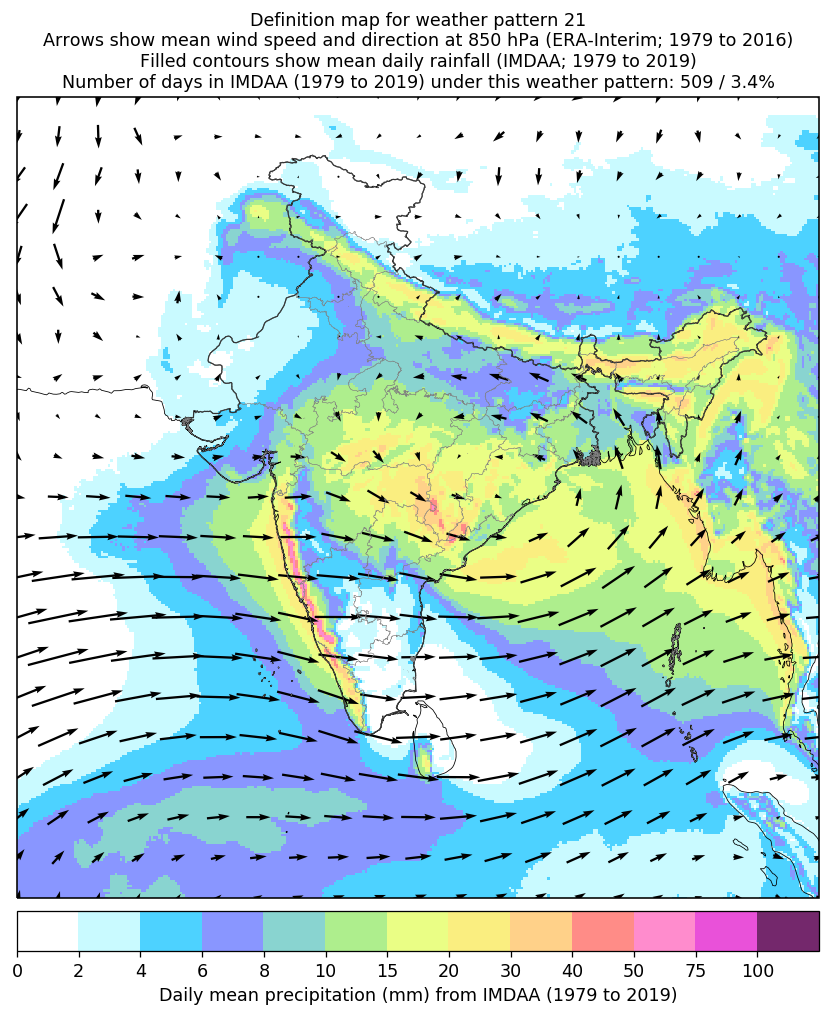
| Pattern 21 | Active Monsoon | 0.0% | 0.0% | 9.7% | ||||||||||
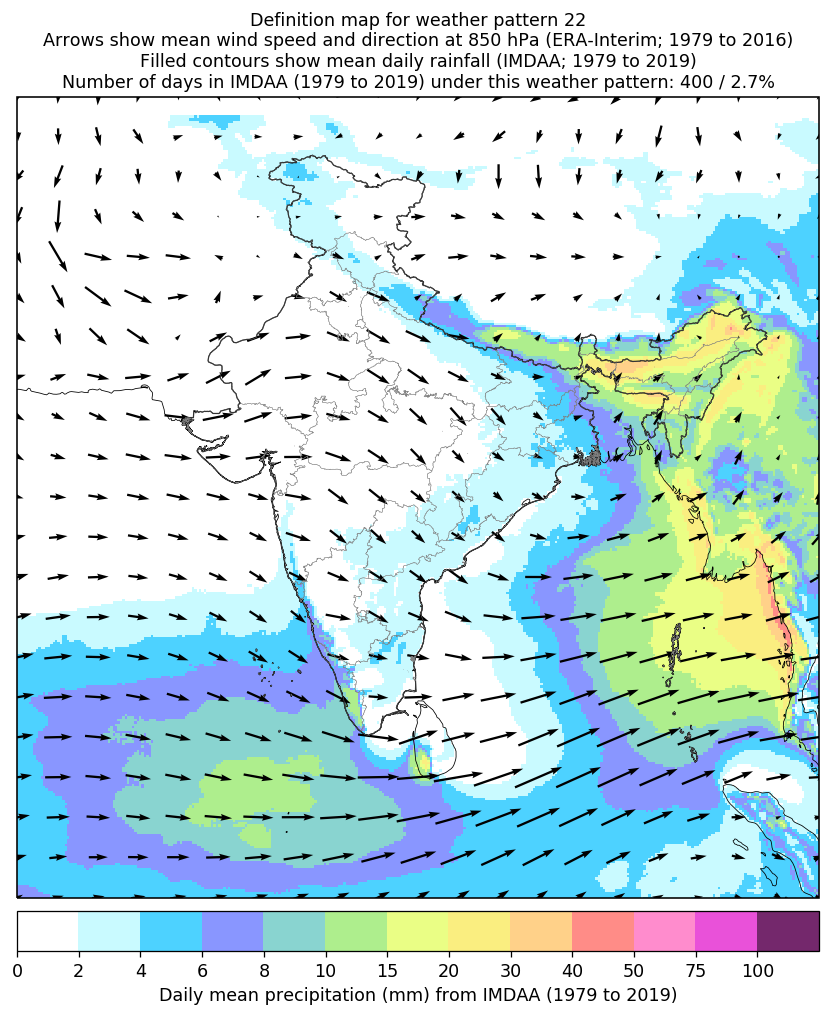
| Pattern 22 | 100% | 100% | 100% | 100% | 100% | 100% | 100% | 100% | 19% | 14% | Pre-Monsoon | 0.2% | 16.4% | 7.1% |
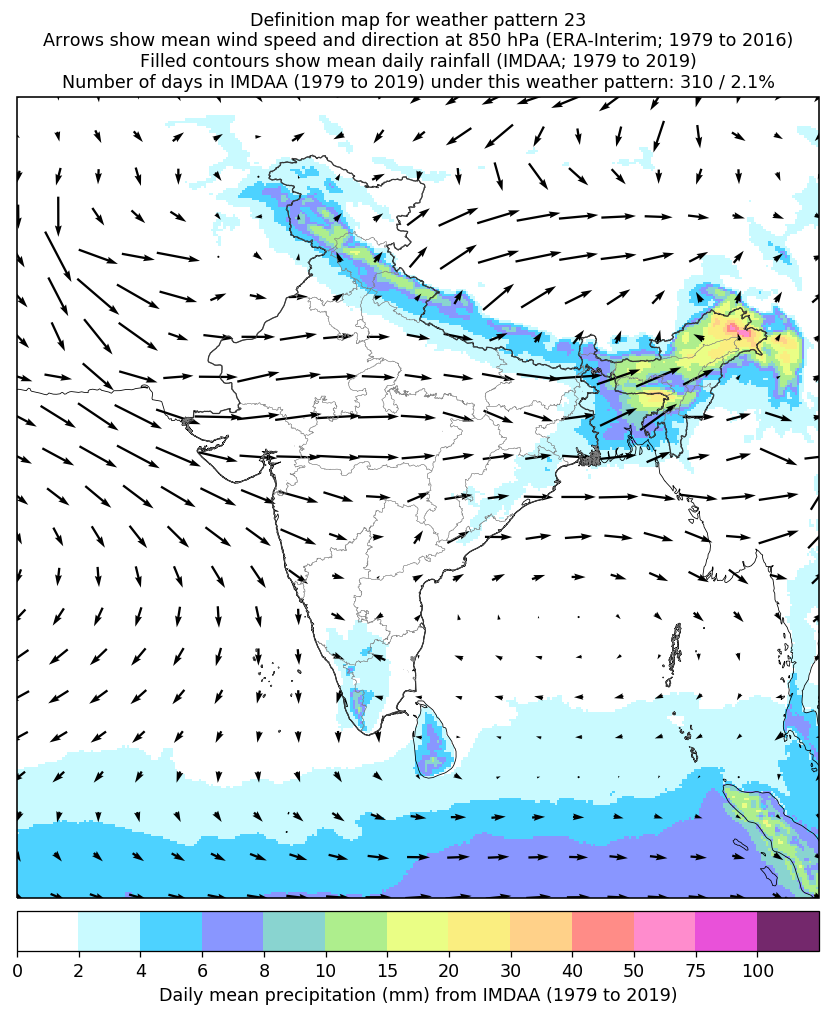
| Pattern 23 | Western Disturbances | 9.8% | 2.8% | 0.0% | ||||||||||
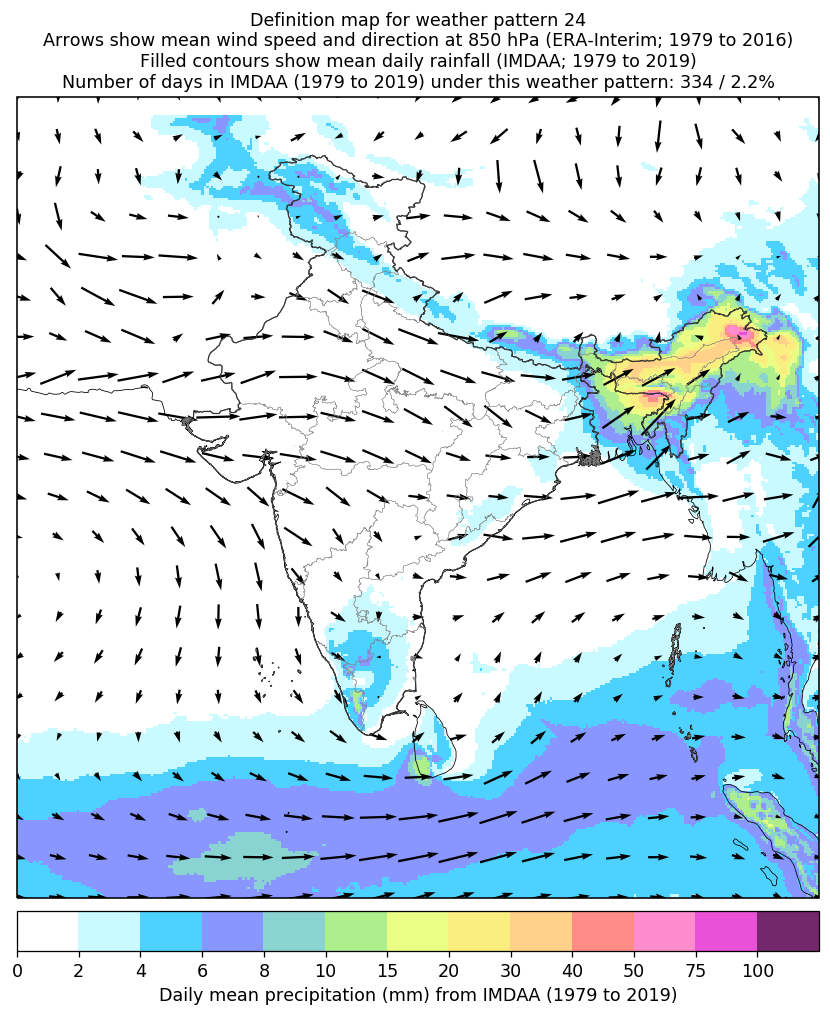
| Pattern 24 | Western Disturbances | 11.0% | 13.6% | 0.2% | ||||||||||
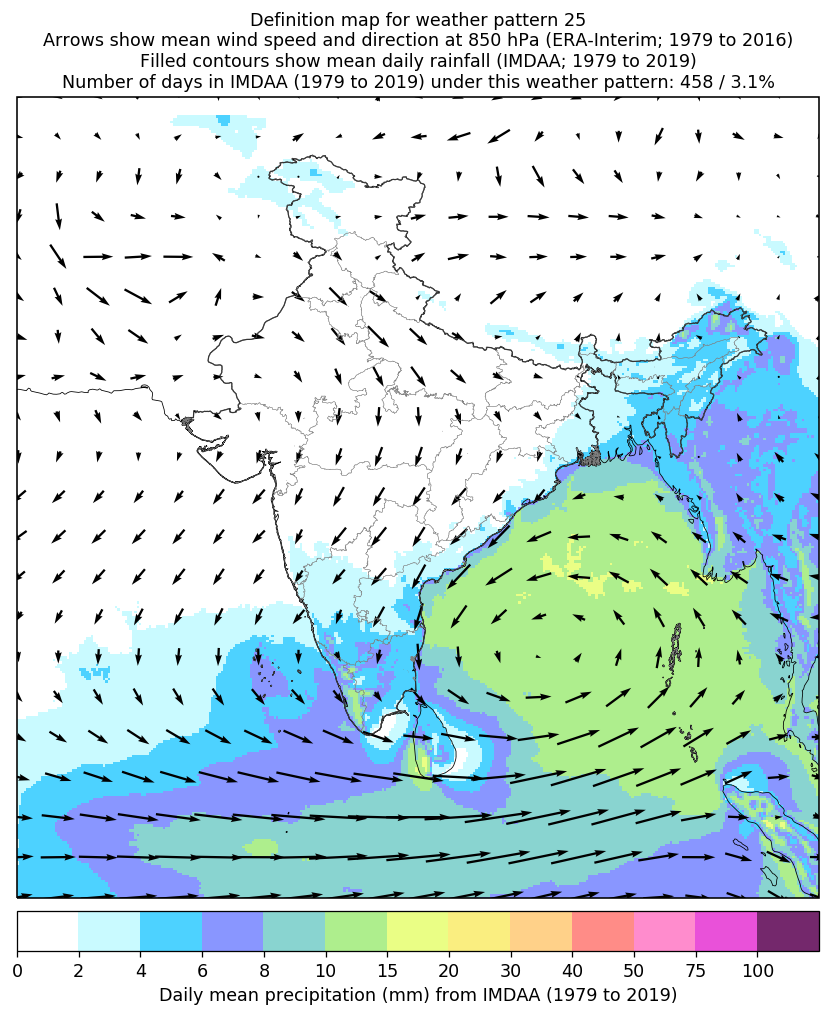
| Pattern 25 | Active Bay of Bengal | 2.1% | 2.1% | 0.0% | ||||||||||
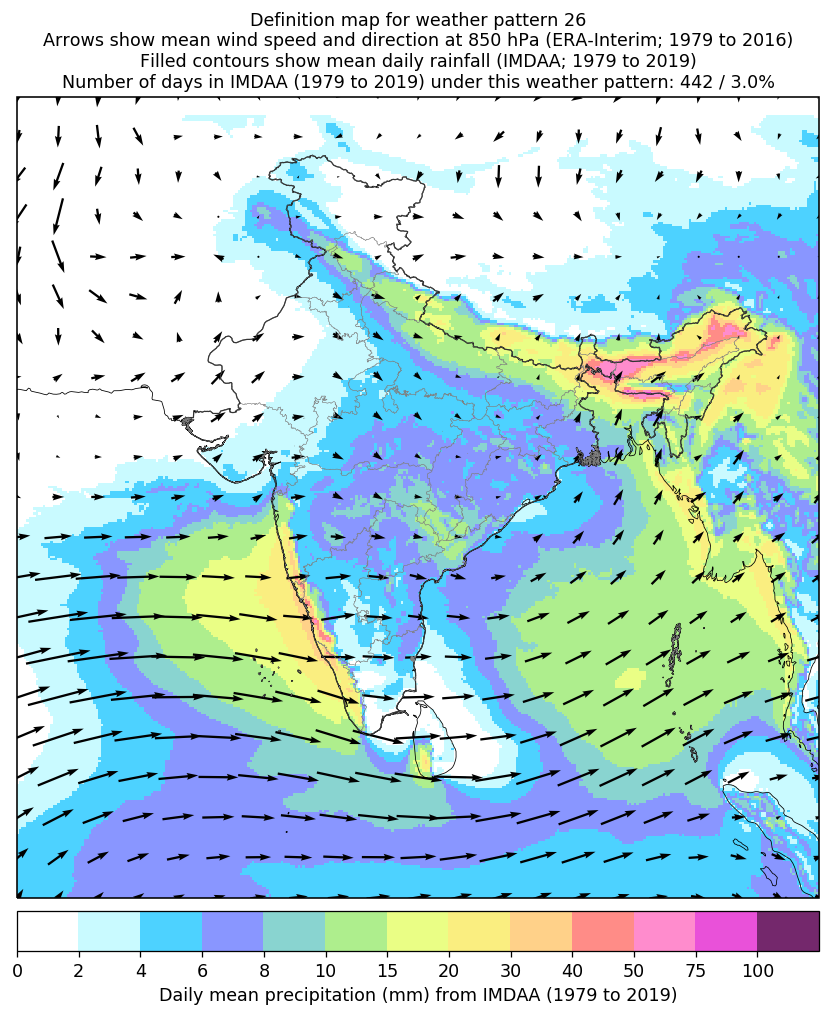
| Pattern 26 | Monsoon Onset | 0.0% | 2.7% | 21.3% | ||||||||||
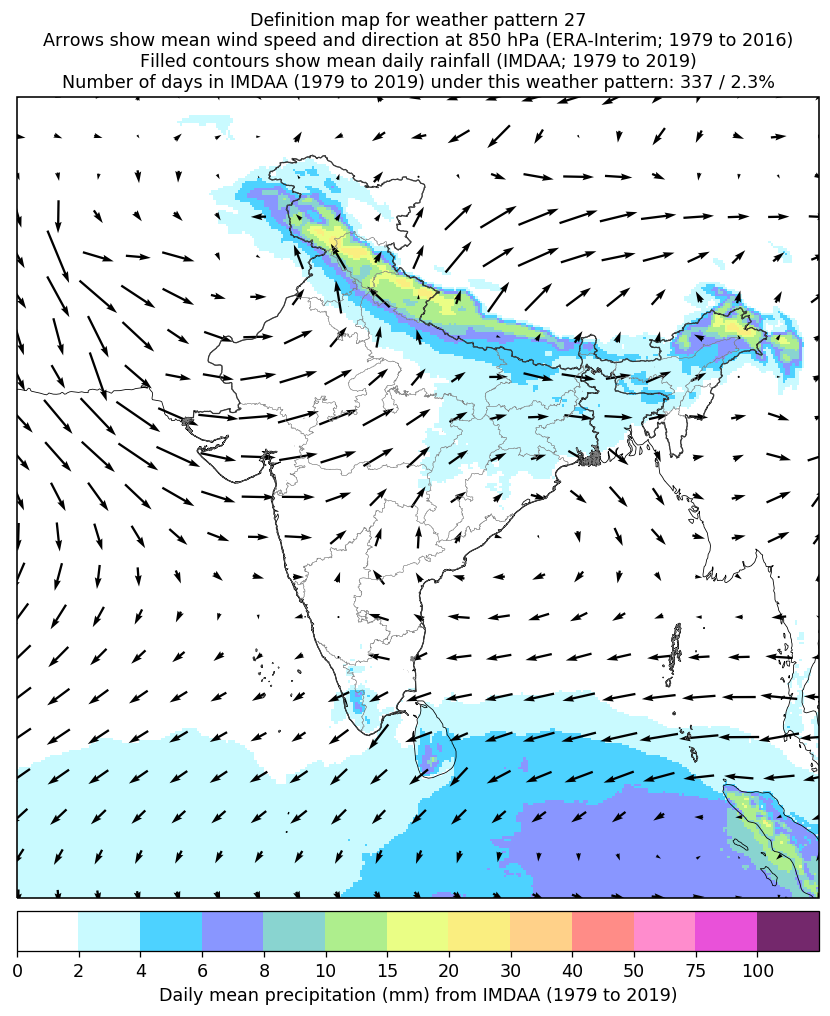
| Pattern 27 | Western Disturbances | 1.8% | 0.3% | 0.0% | ||||||||||
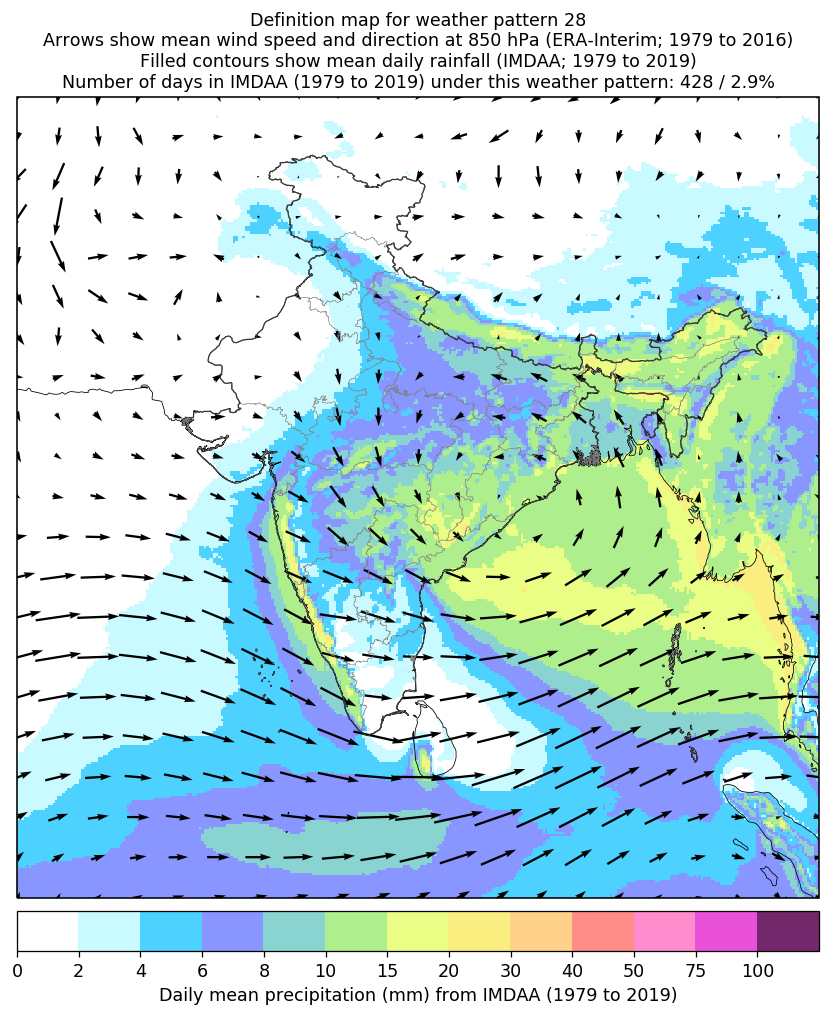
| Pattern 28 | Active Bay of Bengal | 0.0% | 2.0% | 2.4% | ||||||||||
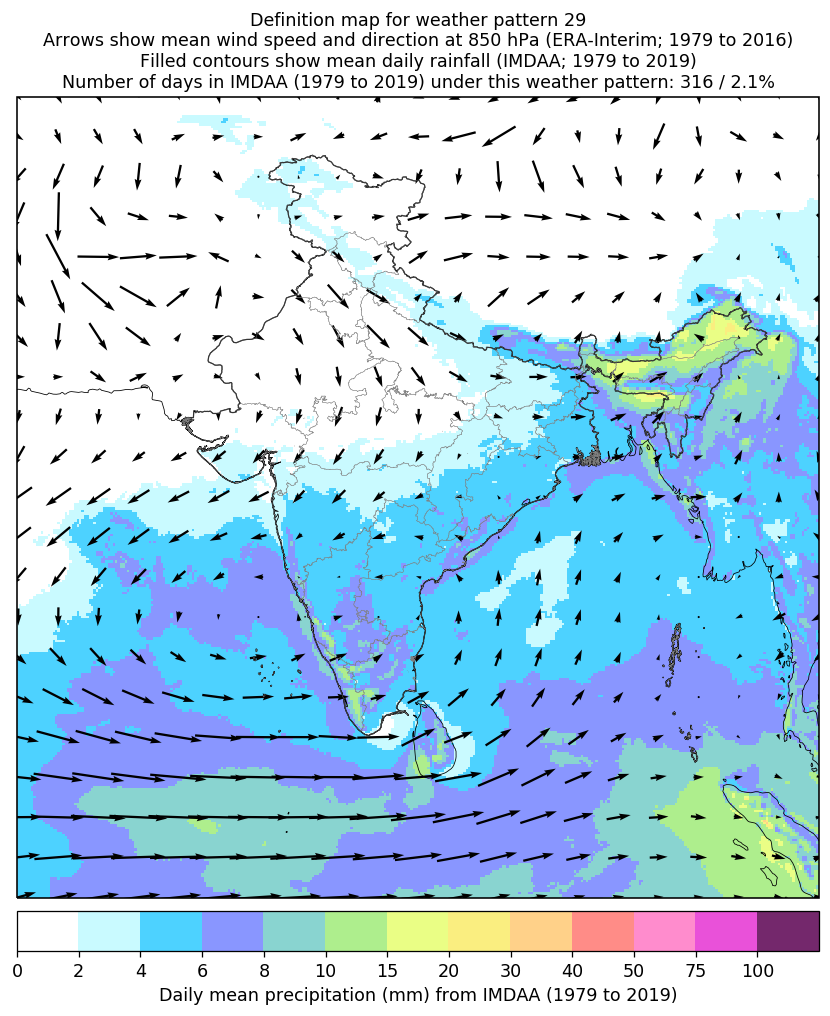
| Pattern 29 | Pre-Monsoon | 0.0% | 1.6% | 1.5% | ||||||||||
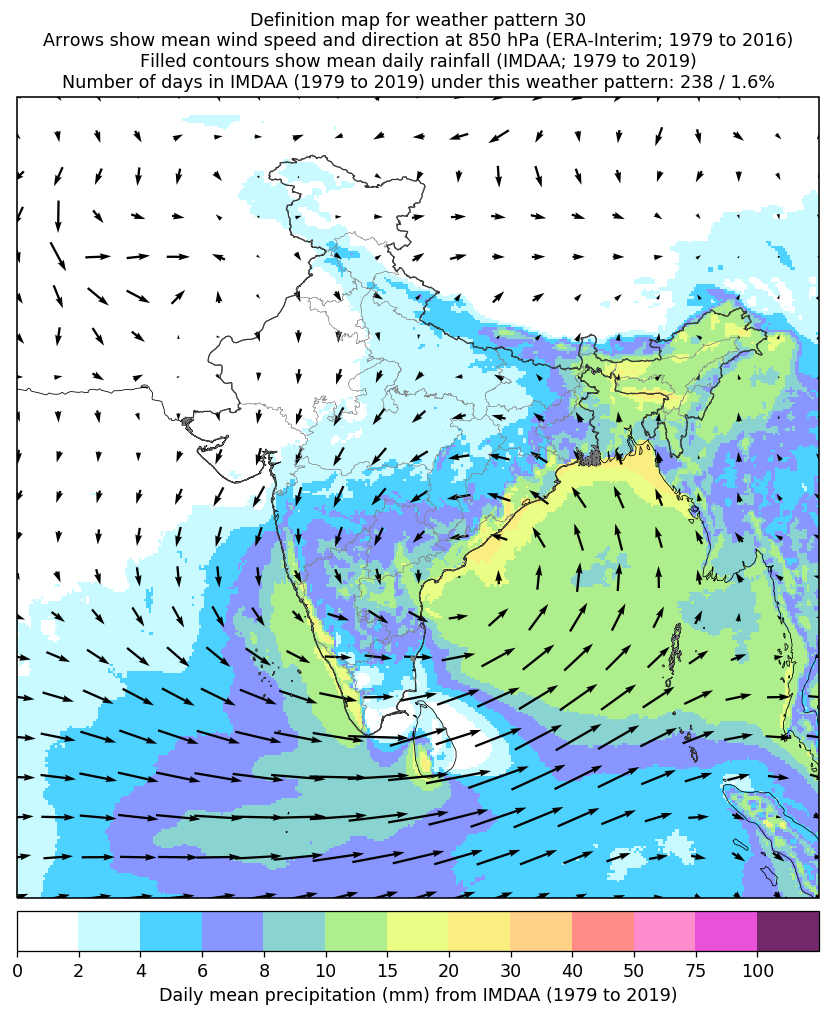
| Pattern 30 | Active Bay of Bengal | 0.0% | 1.9% | 0.8% |
31 May |
1 Jun |
2 Jun |
3 Jun |
4 Jun |
5 Jun |
6 Jun |
7 Jun |
8 Jun |
9 Jun |
|
|---|---|---|---|---|---|---|---|---|---|---|
| Pre-Monsoon | 100% | 100% | 100% | 100% | 100% | 100% | 100% | 100% | 19% | 19% |
| Active Monsoon | ||||||||||
| Western Disturbances | ||||||||||
| Monsoon Onset | ||||||||||
| Spring Dry Period | ||||||||||
| Break Monsoon | 81% | 81% | ||||||||
| Active Bay of Bengal | ||||||||||
| Retreating Monsoon |
31 May |
1 Jun |
2 Jun |
3 Jun |
4 Jun |
5 Jun |
6 Jun |
7 Jun |
8 Jun |
9 Jun |
|
|---|---|---|---|---|---|---|---|---|---|---|
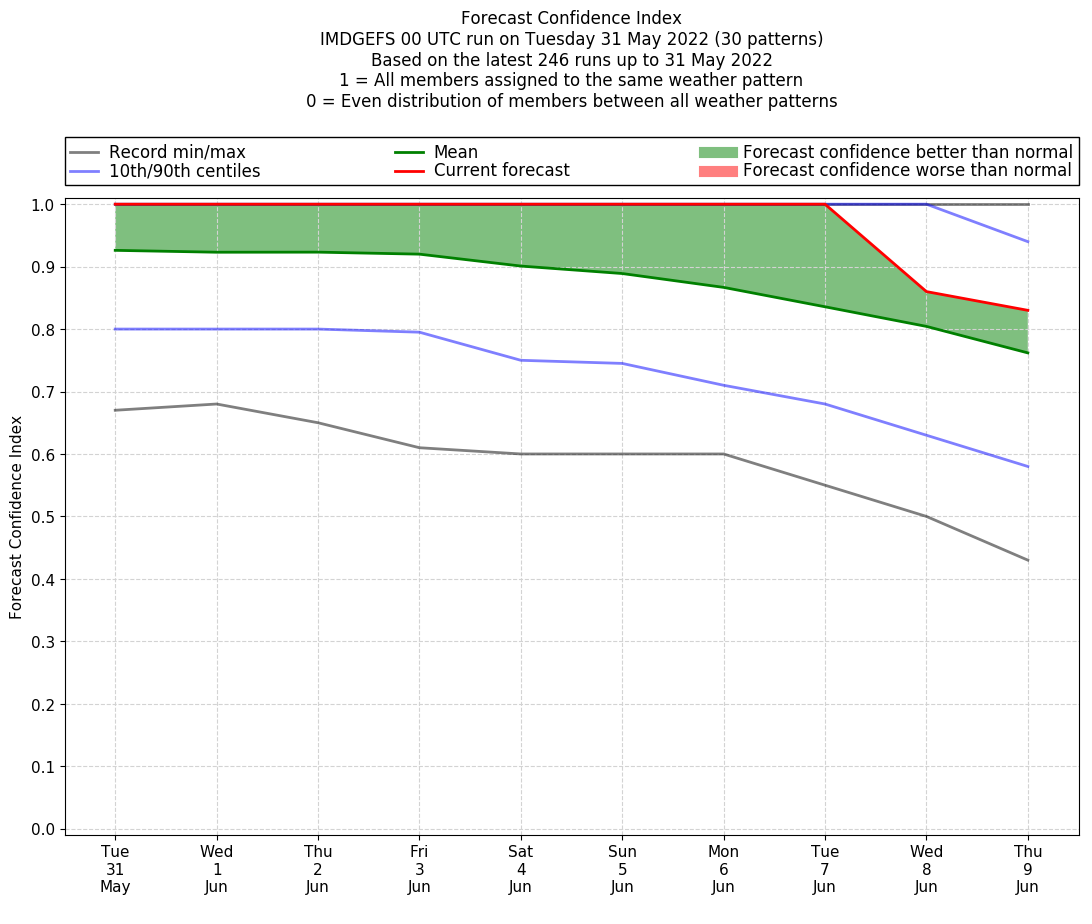
| Latest model run (31/00 UTC) | 100% | 100% | 100% | 100% | 100% | 100% | 100% | 100% | 81% | 81% |
| Previous model run (run -1) | 100% | 100% | 100% | 100% | 100% | 100% | 100% | 100% | 100% | 67% |
| Previous model run (run -2) | 100% | 100% | 100% | 100% | 100% | 100% | 100% | 100% | 67% | |
| Previous model run (run -3) | ||||||||||
| Previous model run (run -4) | 100% | 100% | 100% | 100% | 100% | 100% | 100% | 90% | ||
| Previous model run (run -5) | 100% | 100% | 100% | 100% | 100% | 100% | 100% | 100% | ||
| Previous model run (run -6) | 100% | 100% | 100% | 76% | 95% | 100% | 100% | |||
| Previous model run (run -7) | 100% | 100% | 90% | 71% | 62% | 90% | 100% | |||
| Previous model run (run -8) | 100% | 100% | 67% | 52% | 76% | 100% | ||||
| Previous model run (run -9) | 100% | 100% | 86% | 71% | 57% | 95% |
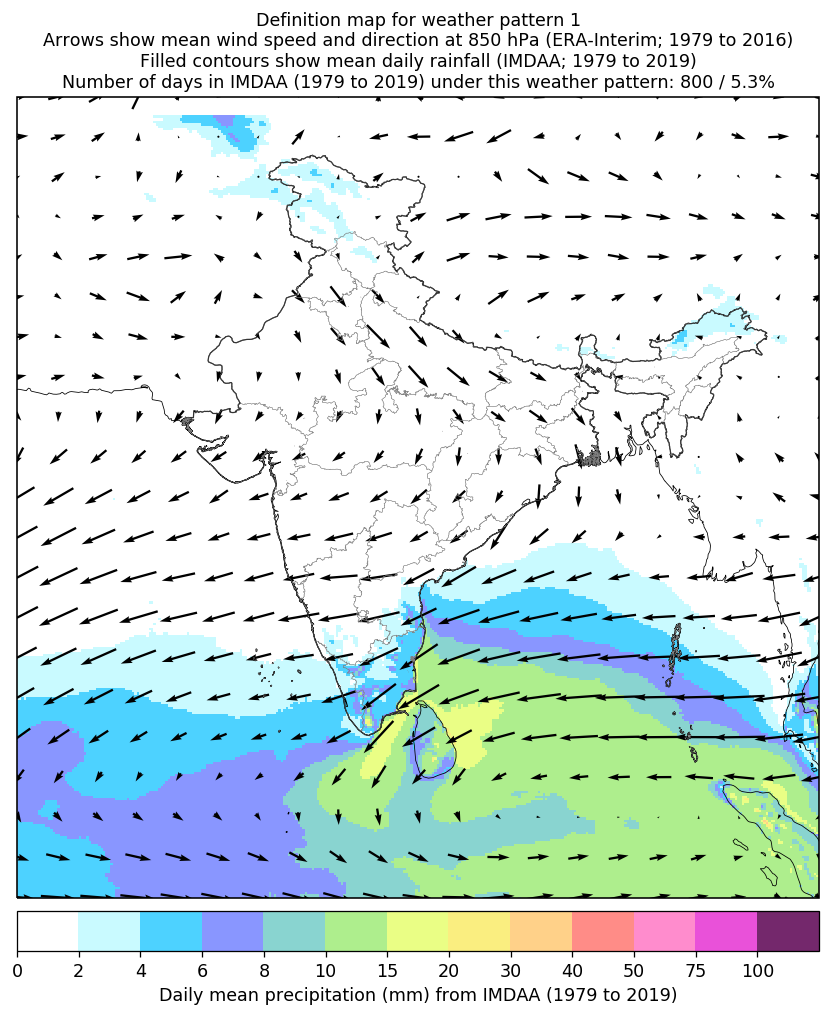
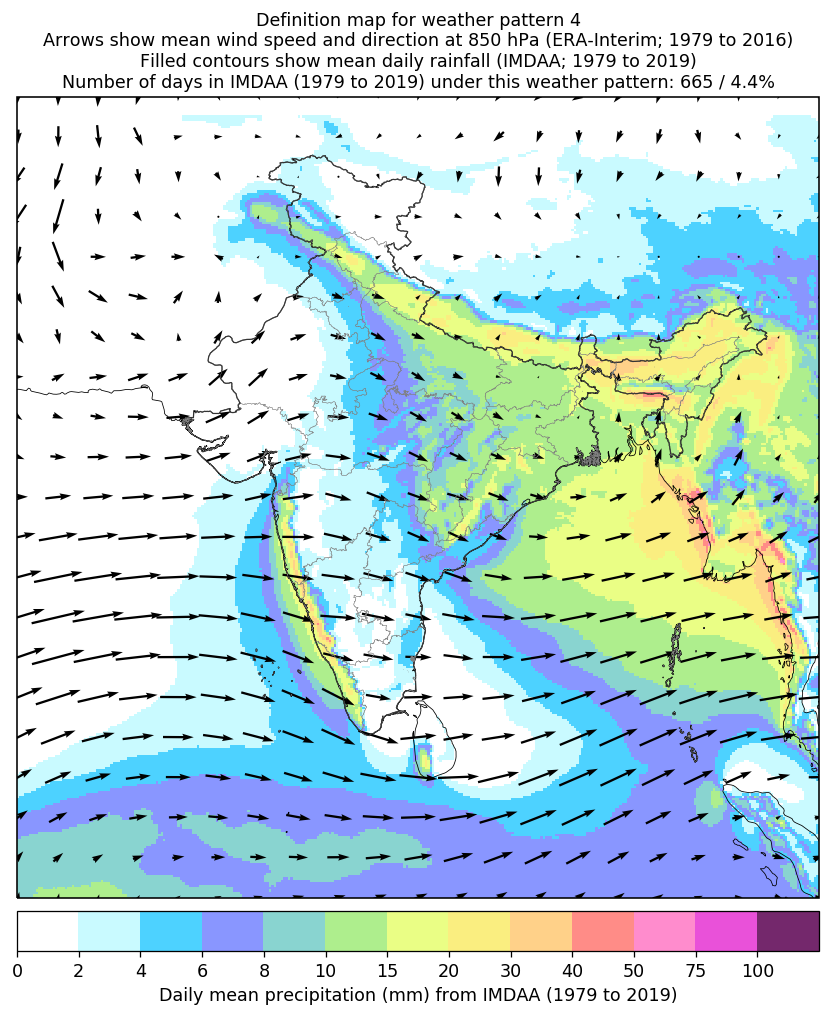
| Weather patterns typically associated with break monsoon tendencies over India are most likely Weather patterns 4, 10 and 11 (break) | |
| Weather patterns typically associated with no active or break monsoon tendencies over India are most likely Weather patterns not listed above and below | |
| Weather patterns typically associated with active monsoon tendencies over India are most likely Weather patterns 17, 19 and 21 (active) |
31 May |
1 Jun |
2 Jun |
3 Jun |
4 Jun |
5 Jun |
6 Jun |
7 Jun |
8 Jun |
9 Jun |
|
|---|---|---|---|---|---|---|---|---|---|---|
| Latest model run (31/00 UTC) | 100% | 100% | 100% | 100% | 100% | 100% | 100% | 100% | 100% | 100% |
| Previous model run (run -1) | 100% | 100% | 100% | 100% | 100% | 100% | 100% | 100% | 100% | 100% |
| Previous model run (run -2) | 100% | 100% | 100% | 100% | 100% | 100% | 100% | 100% | 100% | |
| Previous model run (run -3) | ||||||||||
| Previous model run (run -4) | 100% | 100% | 100% | 100% | 100% | 100% | 100% | 100% | ||
| Previous model run (run -5) | 100% | 100% | 100% | 100% | 100% | 100% | 100% | 100% | ||
| Previous model run (run -6) | 100% | 100% | 100% | 100% | 100% | 100% | 100% | |||
| Previous model run (run -7) | 100% | 100% | 100% | 100% | 100% | 100% | 100% | |||
| Previous model run (run -8) | 100% | 100% | 100% | 100% | 100% | 100% | ||||
| Previous model run (run -9) | 100% | 100% | 100% | 100% | 100% | 100% |
| Weather patterns typically associated with summer monsoon tendencies over India are most likely Weather patterns 12, 13, 15, 15 and 22 (pre/post summer monsoon); 26 (onset); 17, 19 and 21 (active); 4, 10 and 11 (break) | |
| Weather patterns typically associated with no summer or retreating monsoon tendencies over India are most likely Weather patterns not listed above and below | |
| Weather patterns typically associated with retreating monsoon tendencies over India are most likely Weather patterns 1, 6, 18, 25, 28, 29 and 30 (retreating) |
31 May |
1 Jun |
2 Jun |
3 Jun |
4 Jun |
5 Jun |
6 Jun |
7 Jun |
8 Jun |
9 Jun |
|
|---|---|---|---|---|---|---|---|---|---|---|
| Latest model run (31/00 UTC) | 100% | 100% | 100% | 100% | 100% | 100% | 100% | 100% | 100% | 100% |
| Previous model run (run -1) | 100% | 100% | 100% | 100% | 100% | 100% | 100% | 100% | 100% | 100% |
| Previous model run (run -2) | 100% | 100% | 100% | 100% | 100% | 100% | 100% | 100% | 100% | |
| Previous model run (run -3) | ||||||||||
| Previous model run (run -4) | 100% | 100% | 100% | 100% | 100% | 100% | 100% | 100% | ||
| Previous model run (run -5) | 100% | 100% | 100% | 100% | 100% | 100% | 100% | 100% | ||
| Previous model run (run -6) | 100% | 100% | 100% | 100% | 100% | 100% | 100% | |||
| Previous model run (run -7) | 100% | 100% | 100% | 100% | 100% | 100% | 100% | |||
| Previous model run (run -8) | 100% | 100% | 100% | 100% | 100% | 100% | ||||
| Previous model run (run -9) | 100% | 100% | 100% | 100% | 100% | 100% |
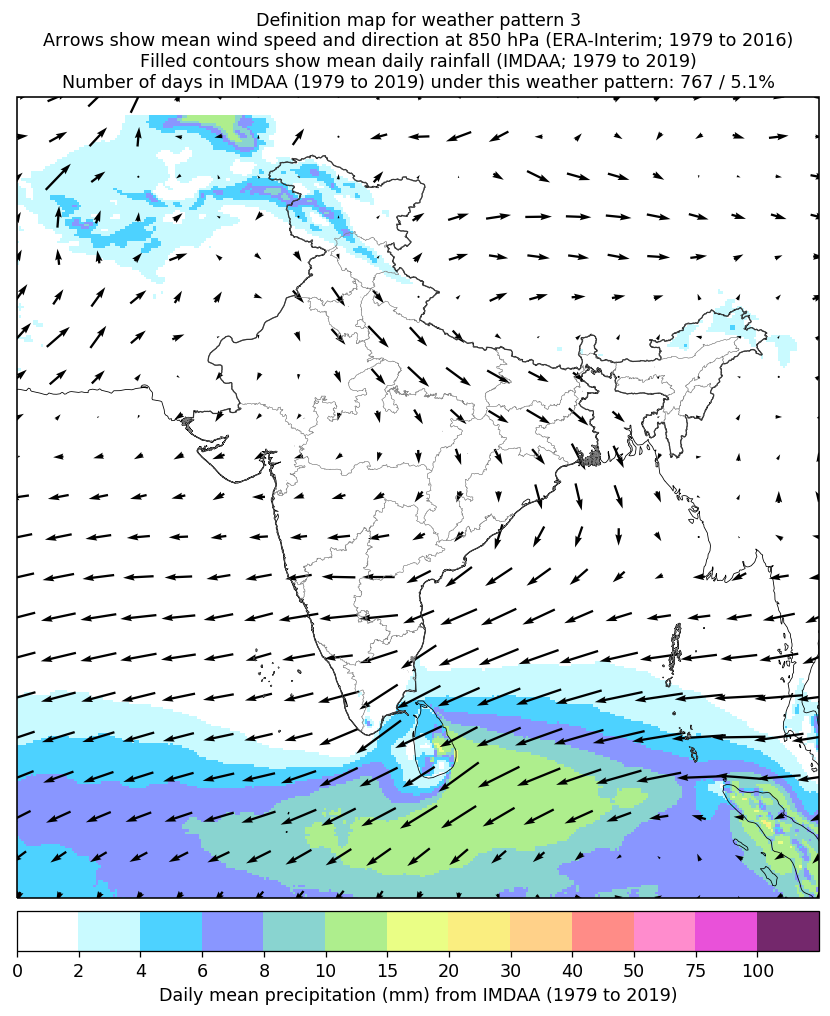
| Weather patterns typically associated with contrywide dry period tendencies over India are most likely Weather patterns 2, 3, 7, 8, 9, 16 and 20 (countrywide winter dry period) | |
| Weather patterns typically associated with no dry period or western disturbance tendencies over India are most likely Weather patterns not listed above and below | |
| Weather patterns typically associated with western disturbance tendencies over India are most likely Weather patterns 5, 23, 24 and 27 (western disturbances) |
31 May |
1 Jun |
2 Jun |
3 Jun |
4 Jun |
5 Jun |
6 Jun |
7 Jun |
8 Jun |
9 Jun |
|
|---|---|---|---|---|---|---|---|---|---|---|
| Latest model run (31/00 UTC) | 100% | 100% | 100% | 100% | 100% | 100% | 100% | 100% | 81% | 81% |
| Previous model run (run -1) | 100% | 100% | 100% | 100% | 100% | 100% | 100% | 100% | 100% | 67% |
| Previous model run (run -2) | 100% | 100% | 100% | 100% | 100% | 100% | 100% | 100% | 67% | |
| Previous model run (run -3) | ||||||||||
| Previous model run (run -4) | 100% | 100% | 100% | 100% | 100% | 100% | 100% | 90% | ||
| Previous model run (run -5) | 100% | 100% | 100% | 100% | 100% | 100% | 100% | 100% | ||
| Previous model run (run -6) | 100% | 100% | 100% | 76% | 95% | 100% | 100% | |||
| Previous model run (run -7) | 100% | 100% | 90% | 71% | 62% | 90% | 100% | |||
| Previous model run (run -8) | 100% | 90% | 62% | 52% | 67% | 95% | ||||
| Previous model run (run -9) | 100% | 100% | 86% | 71% | 57% | 95% |
| Weather patterns typically associated with pre-monsoon tendencies over India are most likely Weather patterns 12, 13, 14, 15 and 22 (pre-monsoon) | |
| Weather patterns typically associated with no pre- or summer monsoon tendencies over India are most likely Weather patterns not listed above and below | |
| Weather patterns typically associated with summer monsoon tendencies over India are most likely Weather patterns 26 (onset); 17, 19 and 21 (active); 4, 10 and 11 (break) |
Ensemble member pattern distances
(CSV file)
Data provided by the India Meteorological Department, MoES, GoI Colloboration with Met Office Under WCSSP Project